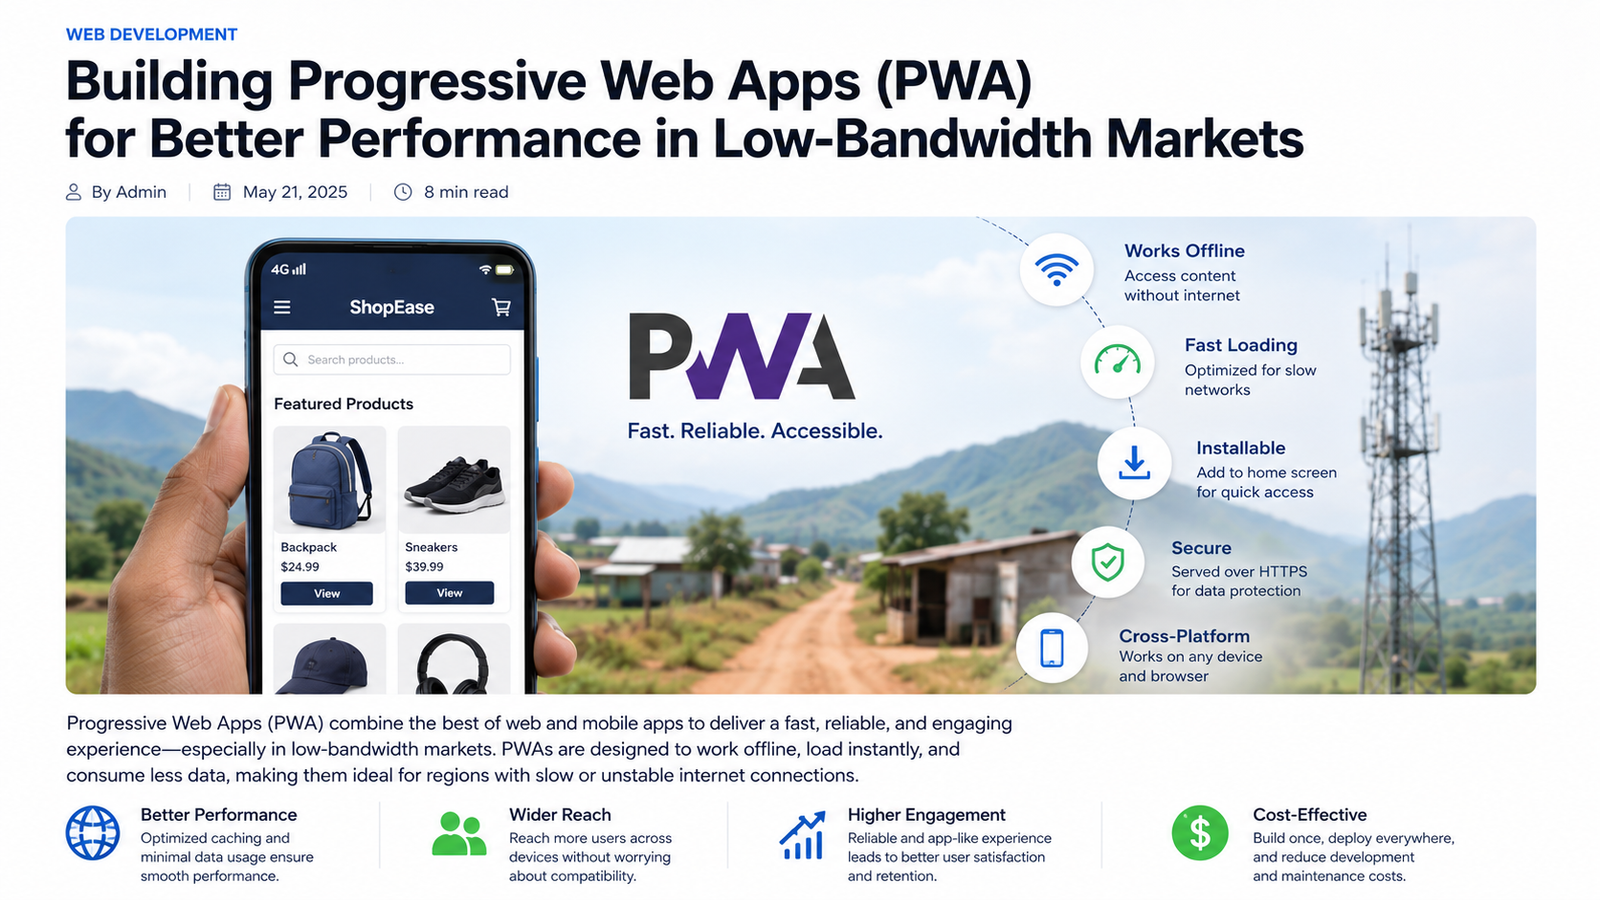
Mobile Data Optimisation for Zimbabwe Business Apps: Build Leaner Apps That Cost Your Customers Less
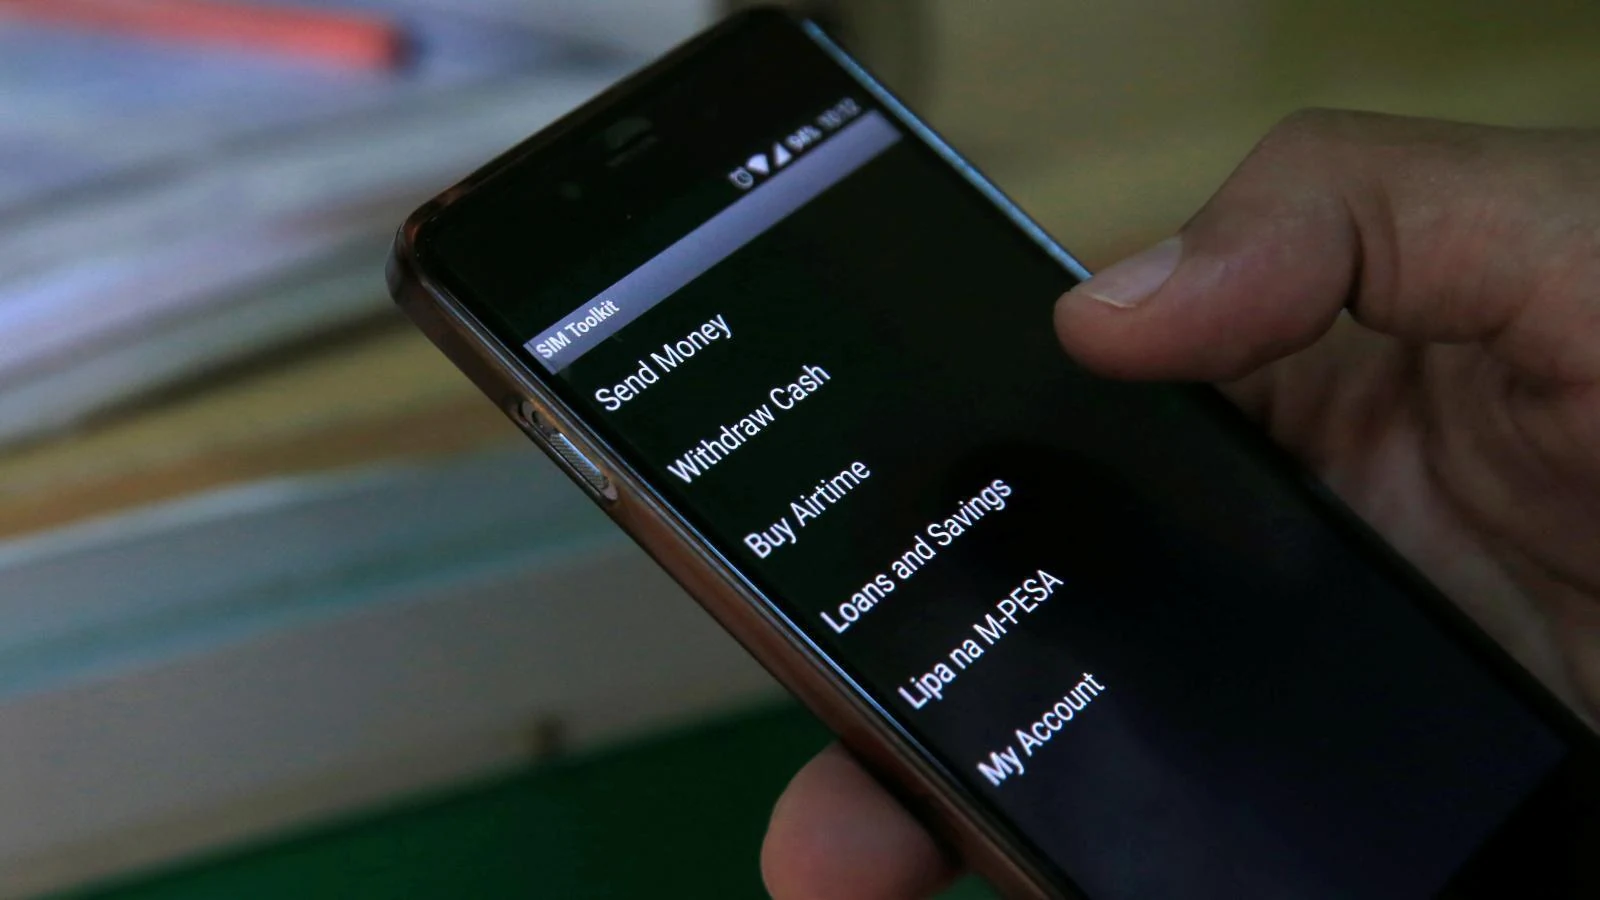
Mobile Data Optimisation for Zimbabwe Business Apps: Build Leaner Apps That Cost Your Customers Less
Here is a number that should shape every decision you make when building a business app in Zimbabwe: 500MB of Econet data costs $3.00 and lasts 30 days if you buy a WhatsApp bundle, or just one hour if you buy a general data burst. For a customer on a tight budget, every megabyte your app consumes is money out of their pocket. If your app is heavy, slow, or data-hungry, they will close it and not come back.
This is not a hypothetical concern. Zimbabwe consistently ranks among the countries with the highest data costs relative to income in Africa. A 1GB bundle costs around $4.00 on a 7-day validity from Econet. For a customer earning $300 to $500 a month, that is a meaningful expense. When your app loads a 2MB hero image before showing any useful content, you have just consumed half a percent of their monthly data budget in a single screen load.
The businesses winning in Zimbabwe's mobile market are not the ones with the flashiest apps. They are the ones whose apps load in under two seconds on a 3G connection, use under 5MB per session, and still deliver a complete, useful experience. This guide shows you exactly how to build that kind of app.
Why Data Optimisation Is a Business Decision, Not Just a Technical One
Before getting into the technical specifics, it is worth understanding the business case clearly. Data optimisation is not about making your developers' lives harder or cutting corners on design. It is about removing the single biggest barrier between your app and your potential customers.
The Zimbabwe Data Cost Reality
As of 2026, Econet Wireless holds approximately 73.75% of Zimbabwe's active mobile subscribers and over 81% of mobile data traffic. Their standard out-of-bundle data rate is $0.0068 per MB, which means a customer who runs out of their bundle and keeps browsing pays $6.80 per GB at out-of-bundle rates. Most customers know this and are extremely cautious about data usage.
The practical implication: if your app's first screen loads 3MB of images and assets before showing anything useful, a significant portion of your potential users will abandon it before they ever see your product. They are not being impatient. They are being financially responsible.
The Conversion Impact
Google's research across emerging markets found that for every additional second of load time, mobile conversion rates drop by up to 20%. In Zimbabwe, where data costs amplify the frustration of slow loads, the drop-off is likely steeper. A business app that loads in 1.5 seconds will consistently outperform an identical app that loads in 4 seconds, not because users prefer speed aesthetically, but because the slower app is visibly consuming their data while making them wait.
Optimising your app's data usage is, in direct terms, a revenue decision.
Image Optimisation: The Biggest Win Available
Images typically account for 60 to 80 percent of a mobile app's data consumption. This is where most Zimbabwe businesses can make the largest immediate improvement.
Choose the Right Format
The format you use for images has a dramatic effect on file size. WebP images are 25 to 35 percent smaller than equivalent JPEG images at the same visual quality. AVIF images are even smaller, though browser support is still catching up. For Zimbabwe business apps, the recommended approach is:
- Product photos and hero images: WebP format, compressed to 80 percent quality
- Icons and logos: SVG format where possible (vector graphics scale perfectly and are tiny)
- Thumbnails: WebP at 60 to 70 percent quality
- Avoid PNG for photos: PNG is lossless and produces files 3 to 5 times larger than WebP for photographic content
Resize Images to Their Display Size
One of the most common mistakes in Zimbabwe business apps is serving a 2000x2000 pixel image in a container that displays it at 300x300 pixels. The user downloads the full 2MB image but only ever sees it at thumbnail size. The fix is straightforward: generate multiple sizes of each image and serve the size that matches the display container.
For a product listing app, you might generate three sizes: a 150x150 thumbnail for grid views, a 600x600 medium for product detail pages, and a 1200x1200 full size for zoom functionality. A customer browsing the product grid downloads thumbnails only. They download the larger image only if they tap into a specific product. This approach can reduce image data consumption by 70 to 80 percent for typical browsing sessions.
Lazy Loading
Lazy loading means images are only downloaded when they are about to enter the user's viewport. Instead of loading all 20 product images when a page opens, the app loads the first 4 visible images immediately and loads the rest as the user scrolls down. For a customer on a limited bundle, this means they only pay for the images they actually see.
Modern web frameworks and native app libraries all support lazy loading natively. It requires minimal implementation effort and delivers significant data savings for content-heavy apps.
API and Data Transfer Optimisation
After images, the second largest source of unnecessary data consumption is inefficient API calls: your app requesting more data from your server than it actually needs to display.
Request Only What You Need
A common pattern in poorly optimised apps is fetching a complete product object (including description, specifications, reviews, related products, and inventory data) just to display a product name and price in a list. The app downloads 15KB of JSON to show 200 bytes of visible content.
The solution is to design your API endpoints to return only the fields needed for each specific view. Your product list endpoint returns: id, name, price, thumbnail URL, and stock status. Your product detail endpoint returns the full object. This approach, sometimes called field selection or sparse fieldsets, can reduce API response sizes by 60 to 80 percent for list views.
Pagination and Infinite Scroll
Loading 200 products at once when the user can only see 8 on screen is a data waste. Implement pagination or infinite scroll that loads 10 to 20 items at a time. As the user scrolls, the next batch loads. This keeps initial load times fast and data consumption proportional to actual usage.
Caching: Pay for Data Once
Caching means storing data locally on the device so it does not need to be downloaded again on subsequent visits. For Zimbabwe business apps, aggressive caching is one of the most impactful optimisations available.
Consider a customer who opens your restaurant app every day to check the menu. Without caching, they download the full menu data every single visit. With caching, they download it once and the app serves the cached version on subsequent visits, only fetching fresh data when the menu actually changes. If your menu changes once a week, you have reduced that customer's data consumption for menu browsing by approximately 85 percent.
Implement cache headers on your API responses with appropriate expiry times. Static content like product images, category icons, and UI assets should be cached indefinitely (with cache-busting on updates). Dynamic content like prices and stock levels should have short cache times (5 to 15 minutes) or use conditional requests that only download new data when something has actually changed.
App Bundle Size and Initial Load
The size of your app itself, the JavaScript, CSS, and assets that must download before anything displays, is the first data cost your users pay. Reducing this is critical for first-time users and for users who clear their cache.
Code Splitting
Code splitting means breaking your app's JavaScript into smaller chunks that load on demand rather than all at once. Instead of downloading the entire app (including the checkout flow, account settings, and admin panel) before showing the home screen, the user downloads only the code needed for the current screen. Additional code loads as they navigate to new sections.
For a typical Zimbabwe business app, code splitting can reduce the initial download from 800KB to 200KB, cutting the first-load data cost by 75 percent. Users see content faster and pay less data to get there.
Remove Unused Dependencies
Many apps include large JavaScript libraries for features that could be implemented with a few lines of custom code. A date formatting library that adds 50KB to your bundle when you only need to display dates in one format. An animation library that adds 80KB when you use one animation. Audit your dependencies regularly and replace heavy libraries with lightweight alternatives or custom implementations.
Compress Everything
Enable Gzip or Brotli compression on your server for all text-based assets (JavaScript, CSS, HTML, JSON). Brotli compression typically reduces file sizes by 15 to 25 percent compared to Gzip, and both are supported by all modern browsers. This is a server configuration change that requires no code changes and delivers immediate data savings for every user.
Real Zimbabwe Business Examples
Mbare Market App, Harare
A fresh produce marketplace app serving Mbare Musika traders in Harare launched in early 2026 with a product catalogue of 400 items. The initial version loaded all product images at full resolution on the home screen, resulting in a 12MB initial page load. User retention after the first session was 23 percent.
After implementing WebP conversion, lazy loading, and a paginated API that returned 12 products per page instead of all 400, the initial load dropped to 1.8MB. The app loaded in under 2 seconds on a 3G connection. Three-month retention improved to 61 percent. The development team estimated that the average customer session now uses 3.2MB instead of 18MB, a reduction that made the app viable for customers on small daily bundles.
Bulawayo Hardware Supplies
A hardware and building materials supplier in Bulawayo built a B2B ordering app for their contractor clients. The app allowed contractors to browse 2,000 SKUs and place orders. The original version had no caching, so every app open triggered a full product catalogue download of 4.5MB.
Their contractors, many of whom work on construction sites with variable connectivity, were abandoning the app when it failed to load quickly. After implementing aggressive caching (product data cached for 30 minutes, images cached for 7 days) and compressing API responses with Brotli, repeat visits dropped to under 200KB of data transfer. Contractors reported the app felt "instant" on return visits. Order frequency through the app increased by 40 percent in the two months following the optimisation.
Gweru Fashion Boutique
A women's clothing boutique in Gweru launched an e-commerce app with high-quality product photography. Each product had 4 to 6 photos at 3MB each. A customer browsing 10 products could easily consume 120MB in a single session, more than a full 30-day WhatsApp bundle.
The solution was a three-tier image strategy: 80KB WebP thumbnails for grid browsing, 300KB WebP medium images for product detail pages, and the original high-resolution images available only on explicit tap for customers who wanted to zoom in. Average session data consumption dropped from 120MB to 8MB. The boutique owner reported that customers who previously said the app "used too much data" began using it regularly after the update.
Monitoring and Measuring Data Usage
You cannot optimise what you do not measure. Before and after any optimisation work, measure your app's actual data consumption using these approaches:
Browser DevTools Network Tab
For web apps and PWAs, Chrome DevTools' Network tab shows every request made during a session, including file sizes, load times, and whether resources were served from cache. Use the "Throttle" option to simulate 3G connections and see exactly what your Zimbabwe customers experience. The "Disable cache" checkbox shows what first-time visitors download.
Lighthouse Audits
Google Lighthouse (built into Chrome DevTools) provides automated performance audits with specific recommendations. Run Lighthouse on your app's key screens and target a Performance score above 80. The audit will flag oversized images, render-blocking resources, and unused JavaScript with specific file sizes and estimated savings.
Real User Monitoring
Tools like Sentry, Datadog, or even simple custom analytics can track real-world load times and data consumption from actual user devices. This is more valuable than lab testing because it reflects the actual network conditions, device capabilities, and usage patterns of your Zimbabwe customers.
Network-Aware Features
Modern browsers and mobile operating systems expose information about the user's current network connection. Your app can use this information to adapt its behaviour automatically.
The Network Information API (available in Chrome and Android WebViews) provides the connection type (4G, 3G, 2G, WiFi) and an estimated effective bandwidth. Your app can use this to:
- Load lower-resolution images automatically when the user is on a slow connection
- Disable autoplay video on 3G connections
- Show a "data saver mode" toggle that users can enable manually
- Defer non-essential content loading when bandwidth is limited
A data saver mode is particularly valuable for Zimbabwe business apps. Give users explicit control over their data consumption and they will trust your app more. A simple toggle that switches from high-quality to standard-quality images, with a visible indicator of estimated data savings, is a feature that resonates strongly with cost-conscious Zimbabwe customers.
Key Takeaways
- Images are your biggest opportunity: Converting to WebP, resizing to display dimensions, and implementing lazy loading can reduce image data consumption by 70 to 80 percent with minimal development effort.
- Cache aggressively: Data that does not need to be downloaded again should not be. Proper caching can reduce repeat-visit data consumption by 85 percent or more.
- Request only what you display: Design API endpoints to return only the fields needed for each view. List endpoints should return minimal data; detail endpoints return full data.
- Measure before and after: Use Chrome DevTools, Lighthouse, and real user monitoring to quantify the impact of your optimisations and identify remaining opportunities.
- Give users control: A data saver mode that users can toggle builds trust and keeps cost-conscious customers engaged with your app long-term.
Frequently Asked Questions
How much does it cost to optimise an existing Zimbabwe business app for data efficiency?
For a typical small business app, a focused data optimisation project takes 2 to 4 weeks of developer time and costs between $800 and $2,500 depending on the app's complexity. The return on investment is usually visible within the first month through improved retention and engagement metrics. Many optimisations, particularly image compression and caching configuration, are one-time changes that deliver ongoing savings.
Will data optimisation make my app look worse or feel less premium?
Done correctly, data optimisation is invisible to users. A WebP image at 80 percent quality is visually indistinguishable from a JPEG at the same quality but is 30 percent smaller. Lazy loading feels natural because images appear as users scroll to them. The only visible change users notice is that the app loads faster, which improves perceived quality rather than reducing it.
Should I build a separate "lite" version of my app for Zimbabwe?
Generally, no. Building and maintaining two separate apps doubles your development costs and creates a fragmented user experience. The better approach is to build one well-optimised app that adapts to network conditions automatically. Network-aware features and a data saver toggle give users control without requiring you to maintain separate codebases.
How do I know if my app is data-efficient enough?
A useful benchmark: a typical browsing session (opening the app, viewing 5 to 10 items, and completing one action) should consume under 5MB of data. Initial app load should be under 2MB. If your app exceeds these thresholds, there are almost certainly optimisation opportunities available. Run a Lighthouse audit and check the Network tab in Chrome DevTools to identify the largest contributors to data consumption.
Does data optimisation help with app speed as well as data costs?
Yes, and the two are directly linked. Smaller files download faster. Cached data loads instantly. Efficient API calls return results sooner. Every optimisation that reduces data consumption also reduces load time. In Zimbabwe's market, where 3G connections are common and 4G speeds vary significantly by location, the speed improvements from data optimisation are often more noticeable to users than the data savings themselves.
Related Articles
About ZimNinja Apps Team
ZimNinja Apps is Zimbabwe's leading PWA development company, specializing in affordable, high-performance Progressive Web Apps for small and medium businesses. Based in Bulawayo and serving clients across Zimbabwe, we've helped hundreds of businesses transform their operations through smart digital solutions.